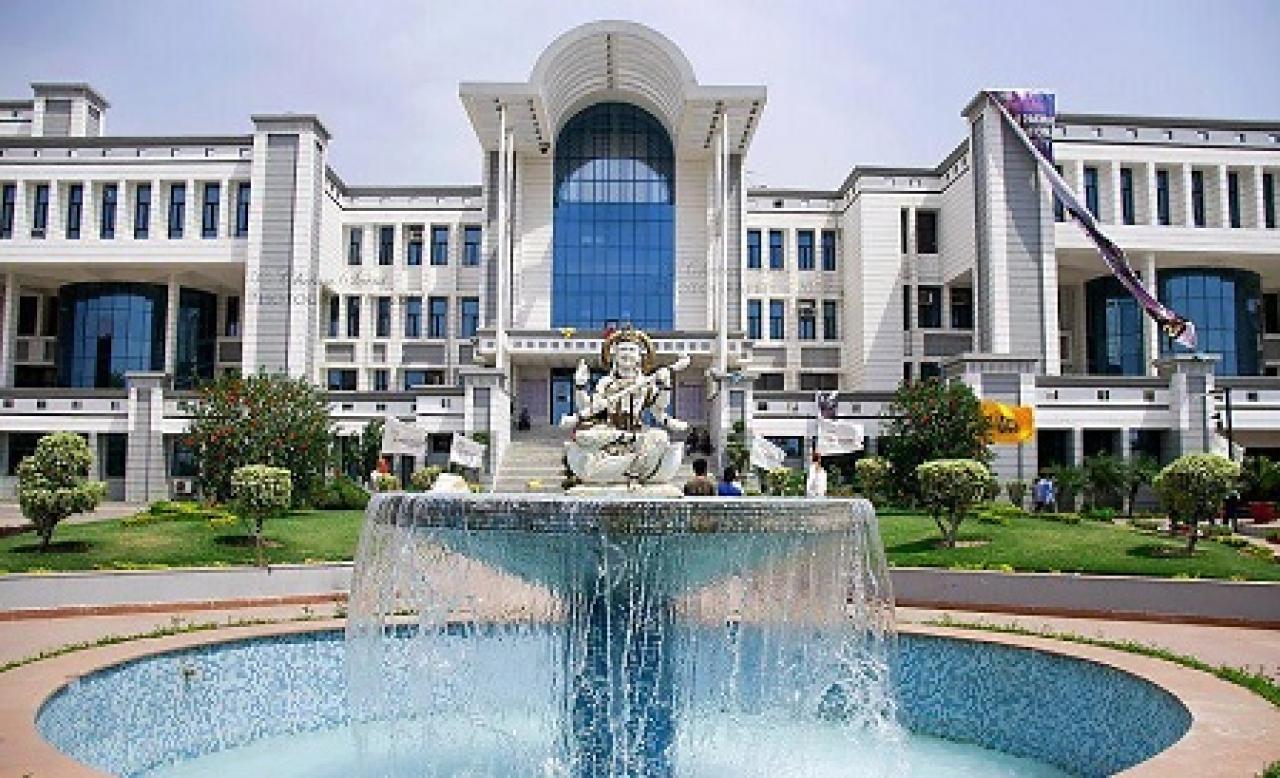
KL University has an excellent placement history with a very high percentage of successful placement of eligible students. The academic year 2024-25 saw over 400 companies on campus, including the likes of Microsoft, Amazon, Infosys, TCS and IBM with a total of over 2,500 placement offers that offered employment to 4,000+ students. To help students meet the challenges in the industry, the university has a placement cell that offers a lot of help by offering pre-placement training, workshops, internships and grooming among other support.
KL University Placements Report
The 2024 placement report of KL University reveals that the university has performed well with over 400 recruiters attending and successfully placed over 4,000 students in different courses such as BTech, MBA, and MCA. Major corporations like Microsoft, Amazon, TCS, Infosys, and IBM actively hire at KL University and provide opportunities in software development, data analysis, business analytics, etc.
| Particulars | Placements Statistics 2024 | Placements Statistics 2023 |
| Number of Recruiters | 474 | 297 |
| Number of Placed Students | 2563 | 2565 |
| Number of Offers | 4728 | 4334 |
| Highest Package | INR 53 LPA | INR 58.2 LPA |
| Top Recruiters | Accenture, BYJU's, Capgemini, Deloitte, Dell, etc | |
KL University Placements 2024 Course-wise
As per the 2024 placement report published by KL University, there is a good performance of the university as 474 recruiters are registered and about 2563 students are being placed by the university in different courses including BTech, MBA, and MCA. The maximum salary package they could offer at home was INR 53 LPA. The below table represents the course-wise statistics of KL University Placements 2024:
| Particulars | Average Package | Highest Package |
| Engineering | INR 8.55 LPA | INR 53 LPA |
| MBA | INR 4.82 LPA | INR 12 LPA |
| MTech | INR 6.87 LPA | INR 12.99 LPA |
KL University Placements Year-wise Trends
The placement trends at KL University over the years show that it has been experiencing steady growth and good employer participation. The university had approximately 2,839 placements in 2023 with 4602 offers, and 347 recruiters, showing the placement change of 31% on 2022.
The below table represents the year-wise trends of KL University Placements:
| Particulars | 2023 | 2022 | 2021 | 2020 | 2019 |
| Offers | 4602 | 4628 | 3236 | 3001 | 2278 |
| Placed Students | 2839 | 2277 | 1908 | 1892 | 1649 |
| Highest Package | INR 58 LPA | INR 55.6 LPA | INR 25.33 LPA | INR 24 LPA | INR 17.5 LPA |
| Average Package | - | INR 9.79 LPA | INR 6.41 LPA | INR 6.33 LPA | INR 6.02 LPA |
KL University Placements FAQs
Is KL University good for placement?
KL University boasts of a good placement record as it has maintained a high placement rate every year. It has a great network of more than 400 best recruiters such as Microsoft, Amazon, TCS, Infosys and IBM.
What is the highest package in KLU?
Recently, the maximum salary package in KL University stood at INR 53 LPA for the engineering domain. These packages indicate a good relationship with the industry and the quality of graduating students at the university.
Is KL University a Tier 1 college?
KL University is a Tier 1 institution because it is NAAC A++ accredited, has NBA accreditation of various programs, and has a good national ranking such as being ranked among the top 25 universities in India according to NIRF 2024. Tier 1 is backed by its steady performance in academics, research, and collaboration with industry.
What is the placement process at KL University?
Placement in KL University is done with the help of a committed placement cell, through stringent preparation that involves pre-placement training, skill development workshops, and placement of internship. Qualified students apply to placements, employer presentations, and undergo aptitude tests, technical interviews, and HR rounds with recruiting firms around campus.
Do KL University provide internship opportunity to the candidates?
Yes, KL University offers great internship opportunities to their candidates. The university offers an internship program of 90 days to provide the students with exposure at work and real world experience.


